It is hard to believe we have passed the halfway point of 2021. After a 2020 that would never end, the first six months of 2021 flew by. With the second half underway, we have updated our views of the markets and economy in LPL Research’s Midyear Outlook 2021: Picking up Speed. Below we provide a summary of those expectations covering the economy, policy, stocks and bonds.
Economy: Speeding Ahead
The U.S. economy has surprised nearly everyone to the upside as it speeds along thanks to vaccinations, reopening, and record stimulus. The growth rate of the U.S. economy may have peaked in the second quarter of 2021, but there is still plenty of momentum left to extend above-average growth into 2022. Despite the natural challenges of ramping back up, the recovery still seems capable of providing upside surprises.
We forecast 6.25–6.75% U.S. GDP growth in 2021, which would be the best year in decades. Last year’s 3.5% drop in GDP, the worst year since the Great Depression, may not be forgotten—but it has been left in the dust of 2020.
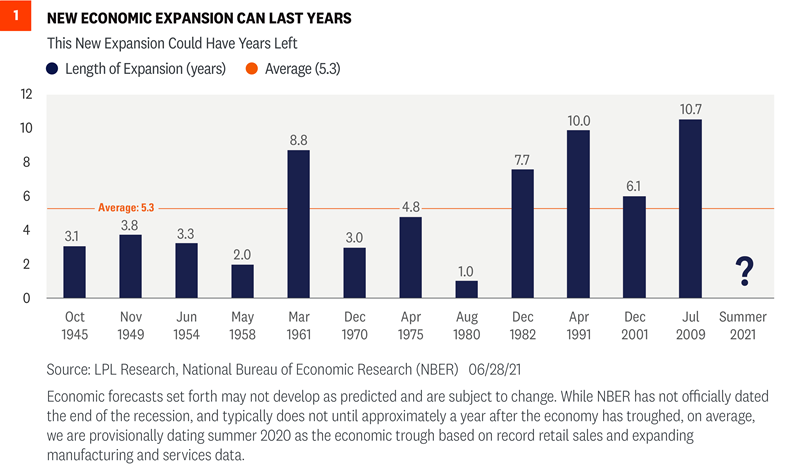
We continue to watch inflation closely but believe recent price pressures are transitory and will begin to work their way off gradually later in the year. As shown in [Figure 1], the average U.S. expansion since World War II has lasted five years and much longer over the last few decades. There’s nothing on the horizon to indicate the current expansion can’t reach that mark.

Policy: Taking A Back Seat
The economy was supported through the pandemic by more than $5 trillion in fiscal stimulus measures and extraordinary support by the Federal Reserve (Fed). Policy was also in the foreground as safety restrictions created a heavy economic burden for many businesses and families. But policy will take a back seat in 2021 as reopening and private sector growth replaces stimulus checks.
The biggest policy risk may be around taxes, with businesses and wealthy households both facing the prospect of a higher tax burden to pay for proposed new spending and help manage the deficit. Historically higher personal tax rates have had only a modest impact on markets, but higher corporate taxes would have a direct impact on earnings growth, potentially limiting stock gains.
Stocks: Gaining Ground
The second year of a bull market is often more challenging than the first, but historically still usually sees stocks climb higher. We expect the strong economic recovery to continue to drive strong earnings growth and support further gains for stocks. However, after one of the strongest starts to a bull market in history—including a more than 90% gain off the March 23, 2020 lows through the first half of 2021—stock prices reflect a lot of good news. As inflationary pressures build and interest rates potentially rise further, the pace of stock market gains may slow.
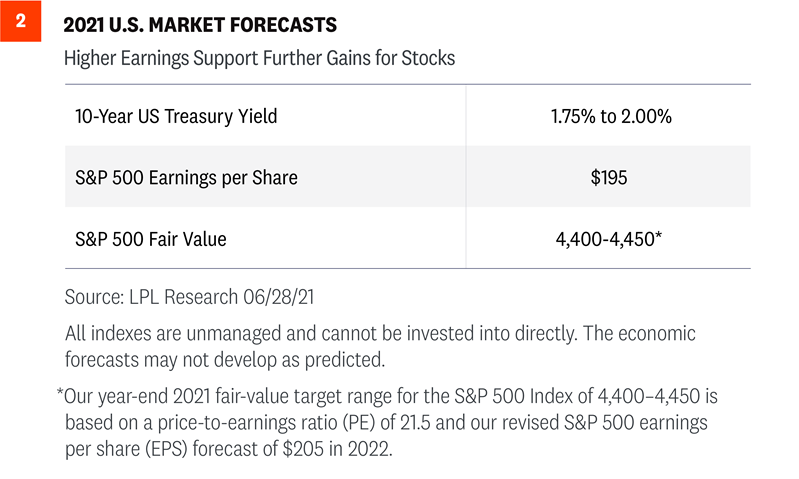
Economic improvement should continue to support S&P 500 Index earnings, which had a stunning first quarter. Reflecting the tremendous strength in corporate profits, our forecast for S&P 500 earnings per share (EPS) in 2021 is $195, a 36% increase from 2020 [Figure 2]. We believe our forecast is reasonable given the strong economic growth outlook and massive amount of fiscal stimulus. We expect corporate America to build on its strong earnings performance in 2022. Our 2021 year-end S&P 500 fair-value target range of 4,400–4,450 is based on a price-to-earnings ratio (PE) of 21.5 and our 2022 S&P 500 EPS forecast of $205.

While valuations remain somewhat elevated, we think they look reasonable after considering still low interest rates and earnings growth potential. Many investors assessing valuations look at the PE and stop there. The S&P 500’s PE is now about 21, compared with the long-term average near 17. By that measure, stocks do look overvalued, but we don’t think that metric provides a complete picture. Interest rates should be considered, as they tell us how much companies’ future profits are worth in today’s dollars, and they allow us to compare high stock valuations to even higher bond valuations. Taking into account expensive bond valuations and low interest rates, we think stock valuations are still reasonable.
If inflation risk remains manageable through year-end, as we expect, and yields rise only gradually, we would expect earnings growth to continue to support stock market gains.
Bonds: Safety Features
Interest rates moved off their historically low levels in the first quarter of the year, but have declined in recent months. Higher inflation expectations, the strong economic recovery, and a record amount of Treasury issuance later this year are all reasons why we believe interest rates may start to climb again. Our target for the 10-year Treasury yield at the end of 2021 remains between 1.75% and 2.0%.
Such a move would leave core investment grade bonds with modest losses over the rest of the year. Nevertheless, bonds still can play an important role in a portfolio as a source of income and as a diversifier during equity market declines.
We are also closely watching the Fed, which may announce plans to reduce its bond purchases later in the year. Any withdrawal of Fed support will likely be small, but could send signals on the future path of rates.
Conclusion
Midyear Outlook 2021: Picking Up Speed was designed to help you navigate a year in which economic conditions may continue to improve dramatically. Understanding the road immediately ahead is essential for navigating its twists and turns, but it will be thoughtful planning and sound financial advice that will keep us on the journey.
Click here to download a PDF of this report.
IMPORTANT DISCLOSURES
This material is for general information only and is not intended to provide specific advice or recommendations for any individual. There is no assurance that the views or strategies discussed are suitable for all investors or will yield positive outcomes. Investing involves risks including possible loss of principal. Any economic forecasts set forth may not develop as predicted and are subject to change.
References to markets, asset classes, and sectors are generally regarding the corresponding market index. Indexes are unmanaged statistical composites and cannot be invested into directly. Index performance is not indicative of the performance of any investment and do not reflect fees, expenses, or sales charges. All performance referenced is historical and is no guarantee of future results.
Any company names noted herein are for educational purposes only and not an indication of trading intent or a solicitation of their products or services. LPL Financial doesn’t provide research on individual equities.
All information is believed to be from reliable sources; however, LPL Financial makes no representation as to its completeness or accuracy.
US Treasuries may be considered “safe haven” investments but do carry some degree of risk including interest rate, credit, and market risk. Bonds are subject to market and interest rate risk if sold prior to maturity. Bond values will decline as interest rates rise and bonds are subject to availability and change in price.
The Standard & Poor’s 500 Index (S&P500) is a capitalization-weighted index of 500 stocks designed to measure performance of the broad domestic economy through changes in the aggregate market value of 500 stocks representing all major industries.
The PE ratio (price-to-earnings ratio) is a measure of the price paid for a share relative to the annual net income or profit earned by the firm per share. It is a financial ratio used for valuation: a higher PE ratio means that investors are paying more for each unit of net income, so the stock is more expensive compared to one with lower PE ratio.
Earnings per share (EPS) is the portion of a company’s profit allocated to each outstanding share of common stock. EPS serves as an indicator of a company’s profitability. Earnings per share is generally considered to be the single most important variable in determining a share’s price. It is also a major component used to calculate the price-to-earnings valuation ratio.
All index data from FactSet.
Please read the full Midyear Outlook 2021: Picking Up Speed publication for additional description and disclosure.
This research material has been prepared by LPL Financial LLC.
Securities and advisory services offered through LPL Financial (LPL), a registered investment advisor and broker-dealer (member FINRA/SIPC). Insurance products are offered through LPL or its licensed affiliates. To the extent you are receiving investment advice from a separately registered independent investment advisor that is not an LPL affiliate, please note LPL makes no representation with respect to such entity.
Not Insured by FDIC/NCUA or Any Other Government Agency | Not Bank/Credit Union Guaranteed | Not Bank/Credit Union Deposits or Obligations | May Lose Value
RES-827100-0721 | For Public Use | Tracking # 1-05168699 (Exp. 07/22)