There is a growing debate over whether an expanding economy, in conjunction with historic fiscal and monetary stimulus, may cause inflation to overheat. Adding to the intense debate, the Federal Reserve (Fed) has shifted its policy framework, potentially allowing inflation to run a little hotter than it has in the past. Despite vocal calls for runaway inflation, we believe that any uptick in inflation will ultimately prove transitory due to slack in the labor market and other structural forces.
What’s Driving the Inflation Debate
Concerns over an inflation scare are rising as investors question whether an accelerating US economy supported by pent-up demand will overheat amid a backdrop of historic fiscal and monetary stimulus. With roughly $3 trillion worth of fiscal stimulus set to take effect in 2021 and a Federal Reserve (Fed) that has expressed its commitment to maintain extraordinary monetary support until its objective of maximum employment is achieved, the concerns are reasonable. Adding to inflation fears, the Fed’s strategy to allow inflation to modestly overshoot its 2% target raises the concern that it may end up scrambling to raise interest rates to control inflation—potentially tightening financial conditions in the process. While we do believe inflation may run hotter than it has in recent years, we believe worries of runaway inflation are overdone and that the upside risk for core inflation will be capped at around 3% for the full year in 2021—and likely will run meaningfully lower.
Near-Term Pressures Appear Well Contained
The US economy has come a long way, but it will take synchronized global growth before economic risks truly begin to abate, and this should limit inflationary pressure as well. Europe, Japan, and other regions have not been able to make the same progress on vaccination efforts, and mixed success in their prolonged battles against COVID-19 has led to slower economic activity relative to the US. We’ve also discussed how some areas of the economy have not participated in the recovery to the same degree, and the bifurcation between goods and services in the US is a perfect example. It’s no secret that service industries have borne the brunt of the economic impact of the pandemic, and this relationship is well illustrated by the changes in the core consumer price indexes (CPI) for goods and services [Figure 1].
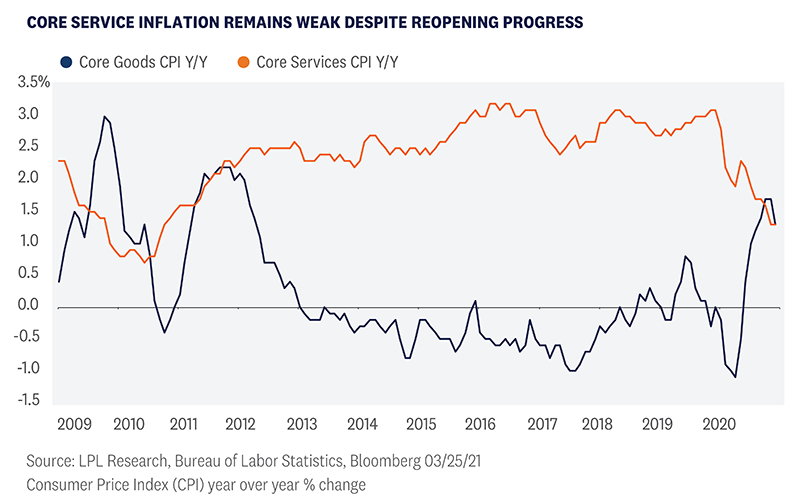
Core service inflation comprises roughly 60% of the broader core CPI measure, so as long as services CPI remains subdued, it is difficult to imagine an environment of runaway inflation taking place. The unemployment rate is currently 6.3%, which should keep wage pressures from materializing in inflation. Further, labor force participation remains about 2% lower than pre-pandemic levels, suggesting the headline unemployment rate is understating the true level of unemployment in the economy. With considerable slack remaining in the US labor market, inflation should remain reasonably contained in the near term.
Structural Forces Affecting Long Term Inflation
We expect inflation to remain under control in 2021, but we also believe there are structural forces at play that have shifted the inflation regime since the environment of the late 20th century, when wages accounted for a larger portion of production costs. As labor’s share of production costs have declined, the Philips curve—the inverse relationship between unemployment and wage growth—has flattened, suggesting that lower levels of unemployment don’t correspond with the same degree of wage growth as in the past. Since the peak of 68% in 2001, labor’s share in private sector costs has declined to around 62%. With a lower share of production costs, businesses don’t have the same need to raise prices in response to a tightening labor market
The most recent economic cycle exemplifies this flattening relationship. Prior to the pandemic, the unemployment rate in the US bottomed at 3.5%, yet the economy still fell short of the Fed’s inflation target of 2%. Looking at the workforce more broadly, populations are aging in developed economies, leading to slowing growth in the labor market. Despite strength in some areas of the economy, economic growth has been limited and the long-term growth outlook for developed market economies still looks muted.
Technological advancements may also be creating headwinds for cost inflation. Advancements in communication technology have accelerated the trend toward globalization, helping contain both labor and material costs. Meanwhile, the expansion of e-commerce has improved price discovery for consumers—commonly referred to as the “Amazon effect.” These powerful forces are likely only to have a growing influence on the world economy that we believe should continue to help limit inflation.
Base Effects to Distort Data in Coming Months
The outbreak of COVID-19 in the spring of 2020 and the subsequent lockdowns created a massive demand shock to the global economy, triggering historic levels of deflation. March, April, and May each saw month-over-month declines in the CPI, with April registering the largest drop in history. As we move forward into these months, year-over-year CPI numbers will experience base effects that will distort the data, so our focus going forward will be on month-over-month increases until these distortions fully roll off.
Where Do We Go From Here?
Inflation concerns have grown as US Treasury yields have risen in recent weeks. Importantly, higher yields have been a combination of both rising inflation expectations and rising real yields, unlike late 2020 when inflation was the focus. The US economy is in a considerably better position than it was at this time last year, but slower economic progress in other regions of the world will continue to present risks to the recovery. Inflation is likely to increase as the economic recovery gathers steam, but we believe there are material headwinds to runaway inflation, both in the near term and the long term.
Click here to download a PDF of this report.
This material is for general information only and is not intended to provide specific advice or recommendations for any individual. There is no assurance that the views or strategies discussed are suitable for all investors or will yield positive outcomes. Investing involves risks including possible loss of principal. Any economic forecasts set forth may not develop as predicted and are subject to change.
References to markets, asset classes, and sectors are generally regarding the corresponding market index. Indexes are unmanaged statistical composites and cannot be invested into directly. Index performance is not indicative of the performance of any investment and do not reflect fees, expenses, or sales charges. All performance referenced is historical and is no guarantee of future results.
Any company names noted herein are for educational purposes only and not an indication of trading intent or a solicitation of their products or services. LPL Financial doesn’t provide research on individual equities.
All information is believed to be from reliable sources; however, LPL Financial makes no representation as to its completeness or accuracy.
US Treasuries may be considered “safe haven” investments but do carry some degree of risk including interest rate, credit, and market risk. Bonds are subject to market and interest rate risk if sold prior to maturity. Bond values will decline as interest rates rise and bonds are subject to availability and change in price.
The Standard & Poor’s 500 Index (S&P500) is a capitalization-weighted index of 500 stocks designed to measure performance of the broad domestic economy through changes in the aggregate market value of 500 stocks representing all major industries.
The PE ratio (price-to-earnings ratio) is a measure of the price paid for a share relative to the annual net income or profit earned by the firm per share. It is a financial ratio used for valuation: a higher PE ratio means that investors are paying more for each unit of net income, so the stock is more expensive compared to one with lower PE ratio.
Earnings per share (EPS) is the portion of a company’s profit allocated to each outstanding share of common stock. EPS serves as an indicator of a company’s profitability. Earnings per share is generally considered to be the single most important variable in determining a share’s price. It is also a major component used to calculate the price-to-earnings valuation ratio.
All index data from FactSet.
Please read the full Outlook 2021: Powering Forward publication for additional description and disclosure.
This research material has been prepared by LPL Financial LLC.
Securities and advisory services offered through LPL Financial (LPL), a registered investment advisor and broker-dealer (member FINRA/SIPC). Insurance products are offered through LPL or its licensed affiliates. To the extent you are receiving investment advice from a separately registered independent investment advisor that is not an LPL affiliate, please note LPL makes no representation with respect to such entity.
| Not Insured by FDIC/NCUA or Any Other Government Agency | Not Bank/Credit Union Guaranteed | Not Bank/Credit Union Deposits or Obligations | May Lose Value |
RES-691144-0321 | For Public Use | Tracking # 1-05125894 (Exp. 03/22)